Storyline visualization techniques have progressed significantly to generate illustrations of complex stories automatically. However, the visual layouts of storylines are not enhanced accordingly despite improvement in performance and the extension of its application area. The existing methods attempt to achieve several shared optimization goals, such as reducing empty space and minimizing line crossings and wiggles. However, these goals are not always conclusive. We conducted a preliminary study to learn how users translate a narrative into a hand-drawn storyline and to check whether the visual elements found in hand-drawn illustrations can be mapped back to appropriate narrative contexts. Moreover, we also compared the hand-drawn storylines with the output of the state-of-the-art automatic layout algorithms and found they have significant differences. Our findings and discussion lead to a design space that summarizes how artists utilize narrative elements and the sequence of actions that artists follow to portray expressive and attractive storylines. We developed an authoring tool, iStoryline, to integrate high-level user interactions into optimization algorithms and achieve a balance between hand-drawn storylines and automatic layouts. iStoryline allows users to create easily a new storyline layout according to their preferences by adjusting an automatically generated layout. The effectiveness and usability of the authoring tool are studied with qualitative evaluations.
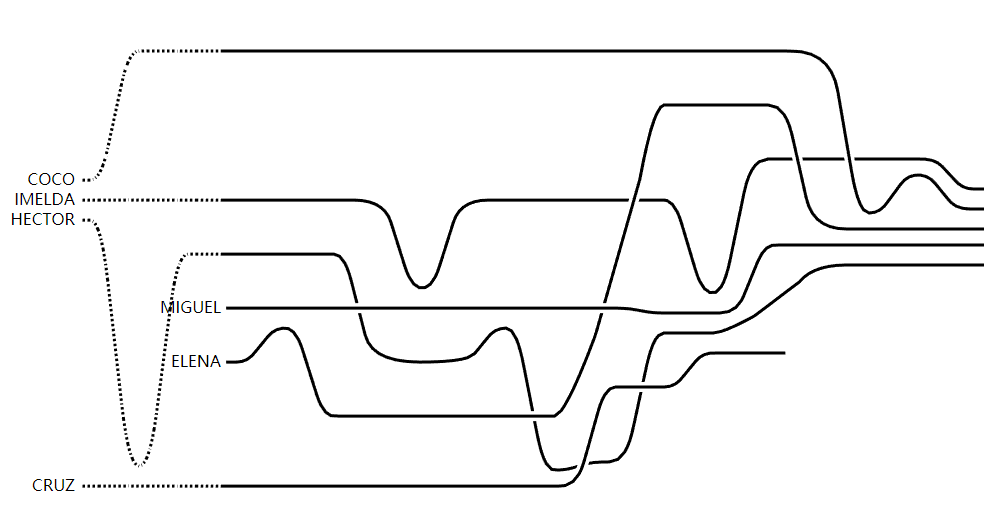
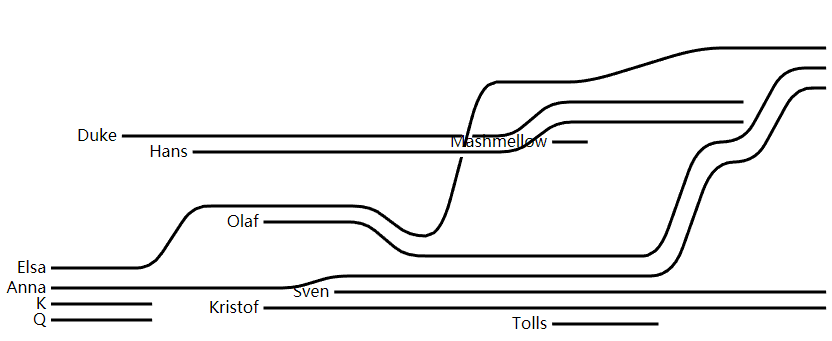
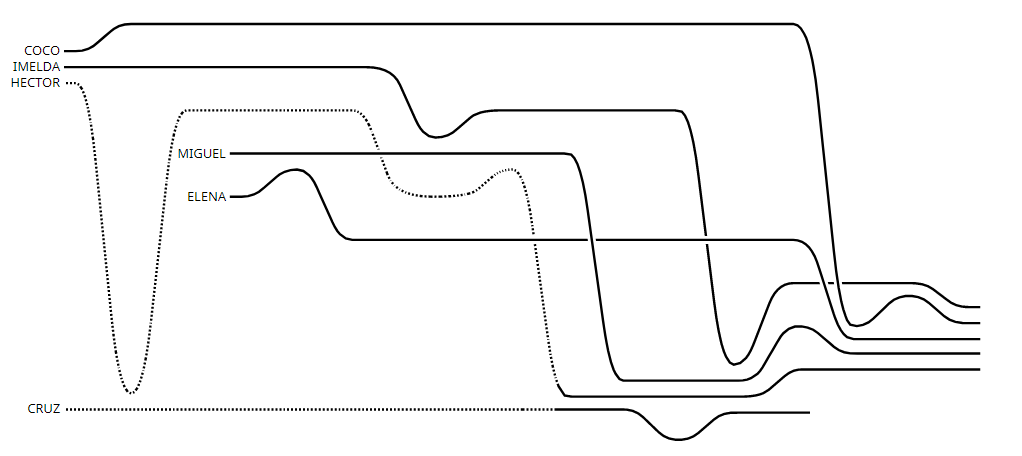
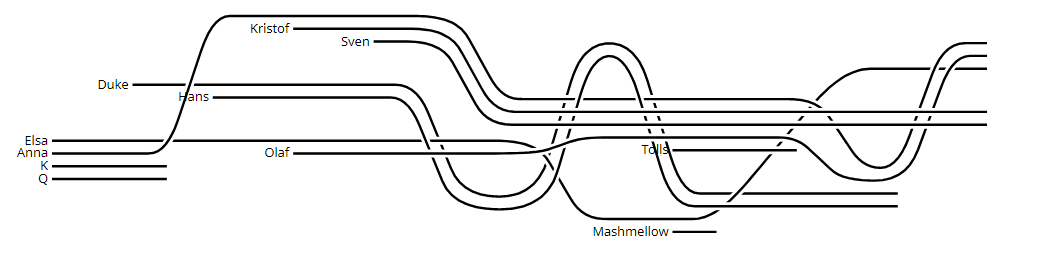
Three design principles (D1 to D3) and three optimization goals (O1 to O3) are defined to track the evolution of relationships between entities and generate aesthetically pleasing and compact storylines automatically.
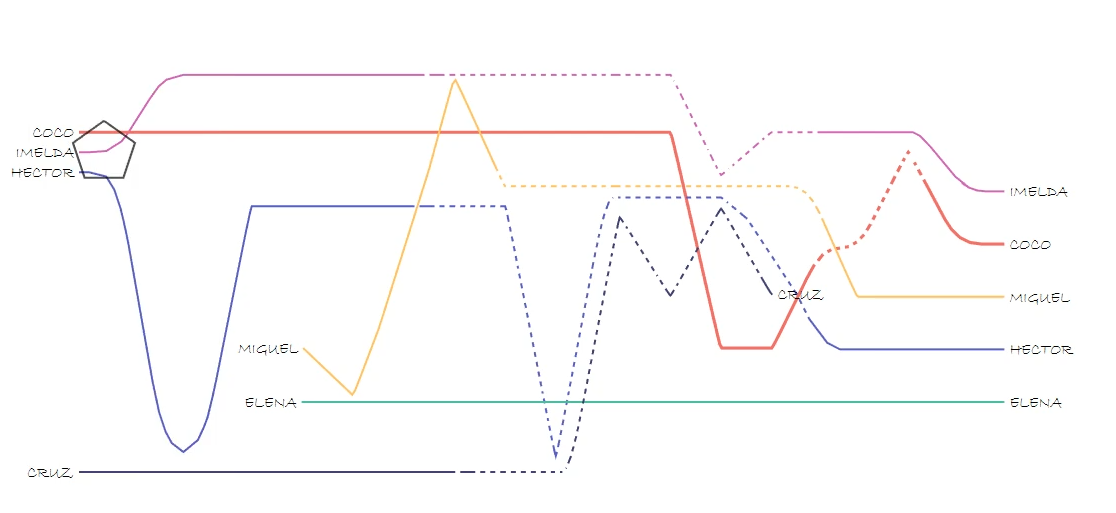
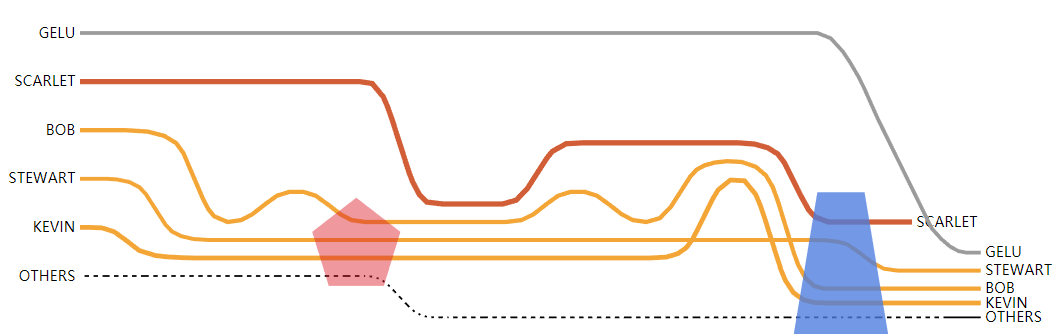
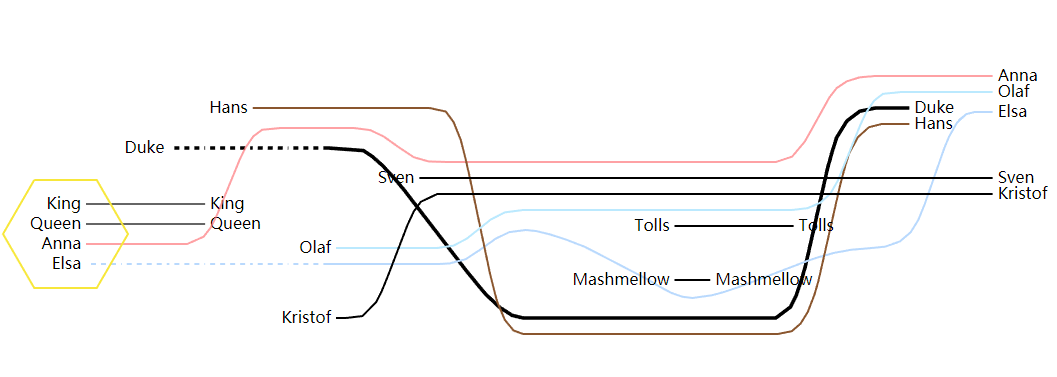
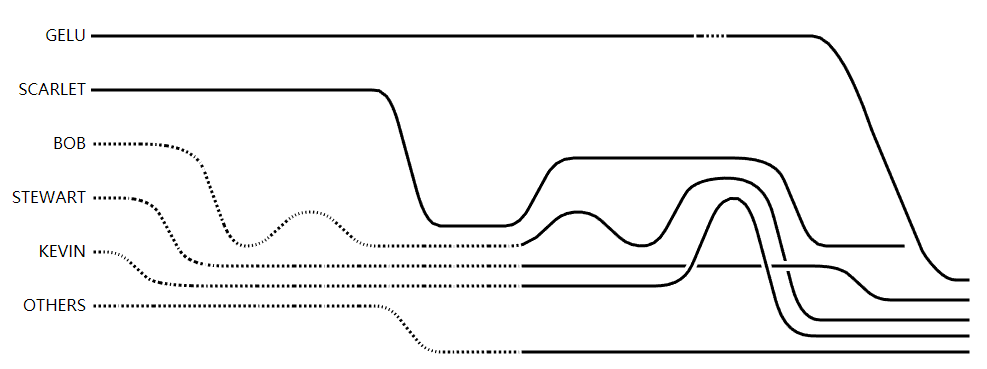
- D1 Lines belonging to the same group should appear next to each other
- D2 Otherwise, lines must be far from each other
- D3 A line must keep straight unless the group where is belongs changes
- O1 Reducing line wiggles
- O2 Reducing line crossings
- O3 Reducing white space
For the preview and the oral talk on IEEE VIS 2018 (Berlin).
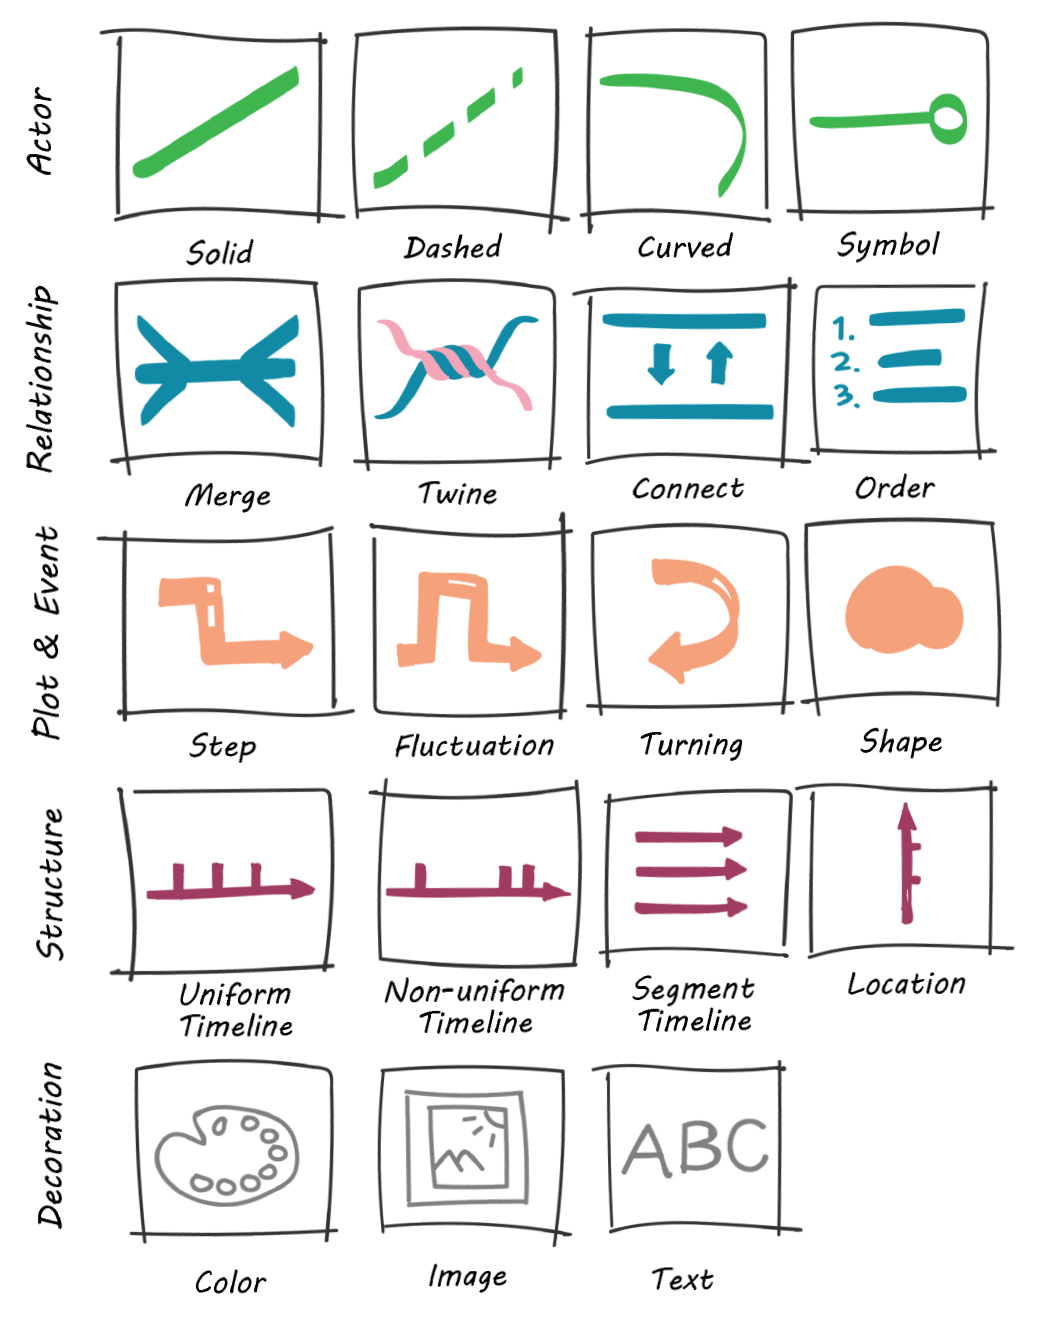
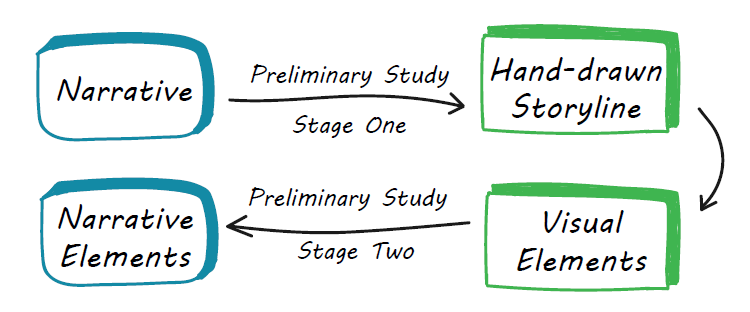
We conduct a two-stage preliminary study to understand the design space of storyline visualization. In the first stage, participants manually draw a storyline layout of a narrative and we identify visual elements which are widely used in hand-drawn storylines. In the second stage, the participants are asked to map a selection of visual elements back to their narrative elements.
First Stage
The goal is to examine what users consider as important narrative elements, what visual elements are commonly used for narratives in the hand-drawn layouts, and the pipeline of creating storylines.
Procedure
- The study starts with three introductory lectures on information visualization and a detailed lecture on storyline visualization.
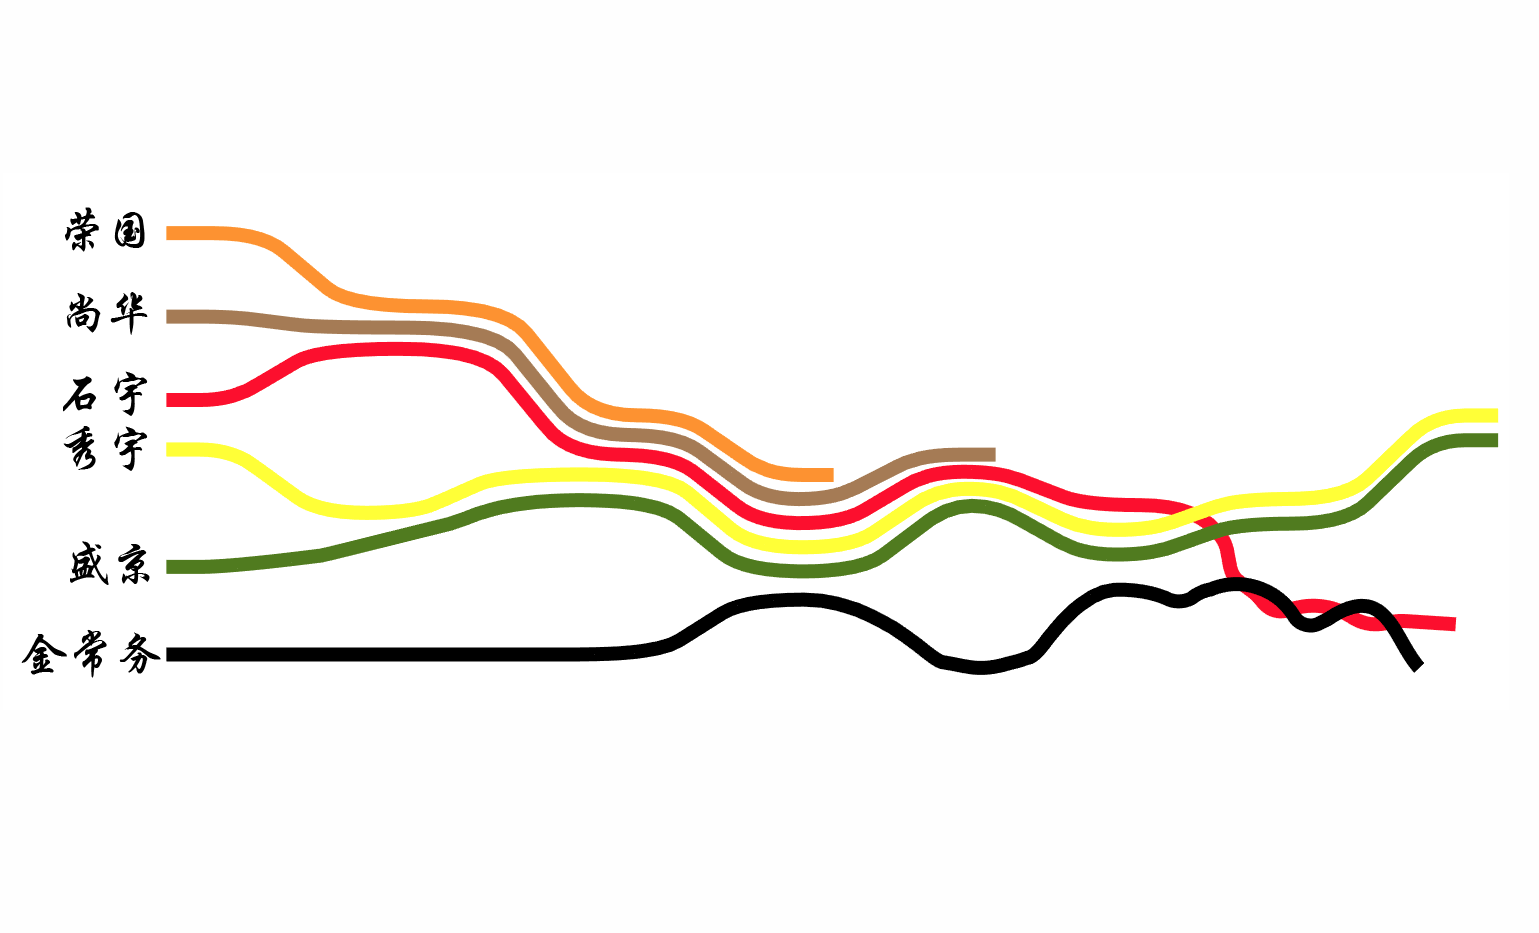
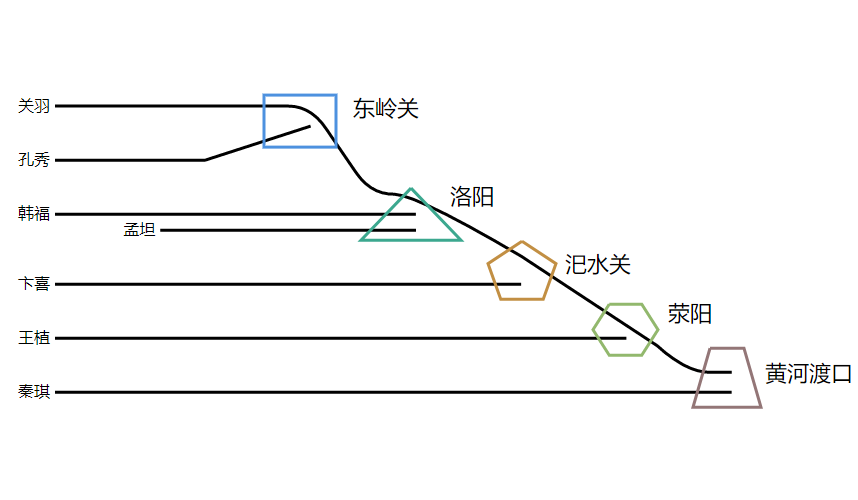
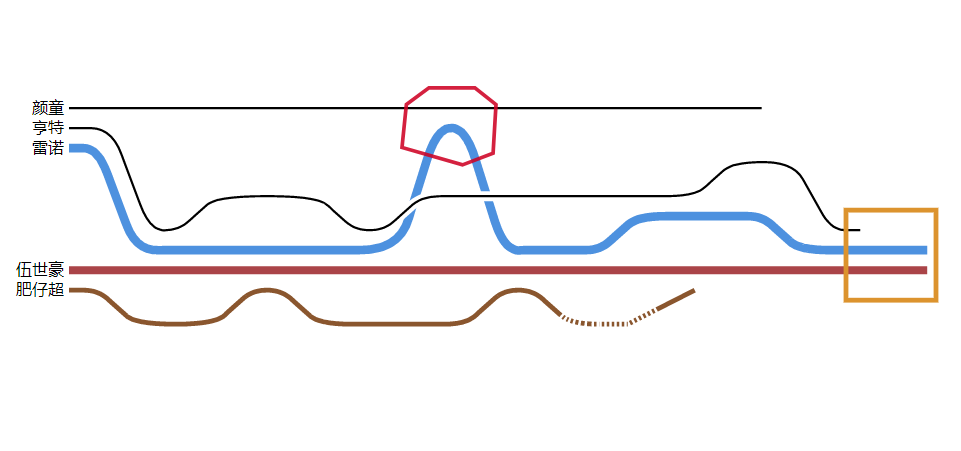
- Each participant is asked to select a story and draw a storyline using pen-and-paper, and we collect their illustrations for further study.
- We identify visual elements from hand-drawn storylines and conduct interviews with participants who propose novel designs.
All hand-drawn storylines can be found in the gallery.
Interview
We interviewed 14 participants who propose novel designs and produce compelling storylines. Their responses can be found in the library.
Second Stage
The goal is to examine a selection of visual elements found in the first stage. First, we want to see whether these elements can be mapped back to meaningful narrative elements. Second, we want to know whether they affect the aesthetics and legibility of final storyline layouts, despite not exactly conforming to traditional design principles and optimization goals.
Tasks
- Describe the possible narrative meaning of the visual element and associate a narrative context to the visual element: an actor, a relationship or a story/event.
- Rate the visual element in both the hand-drawn and automatic storyline conditions from different aspects.
- Discuss the implication of the visual element in the storyline visualizations.
Procedure
- The study begin by showing a visual element and the participant is asked to start Task 1.
- We present two stories containing the corresponding narrative elements, and the participant is asked to start Task 2.
- The participant is asked to discuss whether the given visual element can convey the narrative content in the hand-drawn illustrations in Task 3.
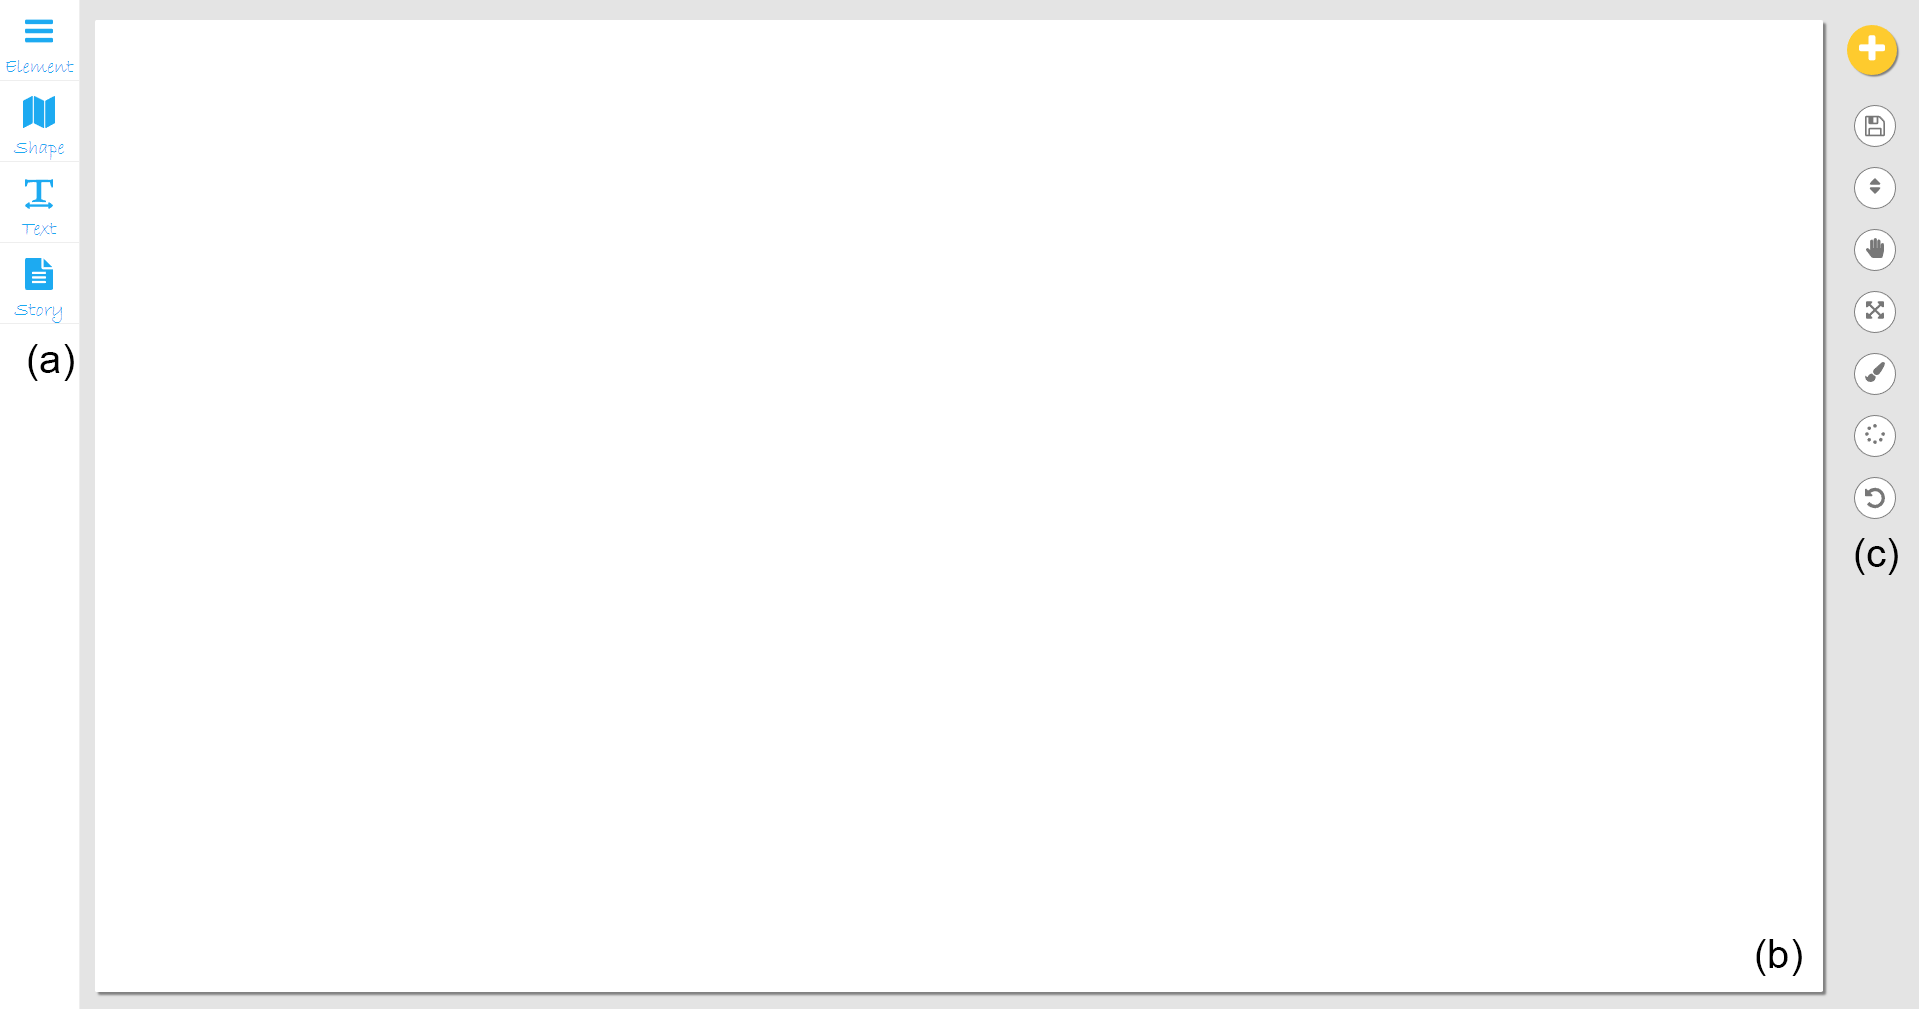
iStoryline is composed of three UI components. (a) shows the panels that controls the visual properties of storylines. (b) is the visualization canvas. (c) presents easy-to-use interactions which enable users to lay out storylines according to their design preference.
iStoryline provides five high-level interactions which enable users to re-layout storylines.
Shifting
Bending
Scaling
Curving
Twining
We conducted a task-based study to assess the effectiveness and intuitiveness of the interactions supported by iStoryline, and we further held a semi-structured interview with the participants. We recruited 12 students (6 males and 6 females). Nine of them had experience using graphics editors, such as Adobe Illustrator and Photoshop, while others did not have such experiences. We asked participants to generate a storyline layout by interactively adjusting one automatically-generated layouts using iStoryline. All managed to complete the task successfully.
Below are the results.